Clustering Munich
Posted
It so happens that I need to write a blog post as the final assignment of a Coursera specialization, so here goes - it will also be useful to jot down some of what I learned.
This final project is a more or less free assignment, nach dem Motto fatti una domanda e datti una risposta. The only rule is that the question should be answerable by collecting geographic data and running k-means clustering.
It’s not like the assignment pops out of nowhere - there are several examples along the course, and you can build on that. In one of these assignments the idea was to analyze the neighbourhoods of Toronto after being shown an example with the ones in Manhattan: You pick a table with neighbourhood names and coordinates, draw a ball around each coordinate, see what’s inside and check whether there’s some kind of natural clustering, whatever that means. Already back then I had tried to run the exercise with Munich, because I honestly don’t care that much about Toronto, except (as usual) real data is messier than precooked example.
What happened in the Toronto dataset is that you had the city divided in postal codes and every postal code neatly divided in neighbourhood with tiny cute names and geographic coordinates; what happens in Munich is that there’s a complete mismatch between postal codes and neighbourhoods - postal code X covers part of neighbourhood A and part of neighbourhood B, neighbourhood A in its entirety covers part of postal code X and part of postal code Y -, and neighbourhood names seem to be composite of subneighbourhoods, but the internal subdivision is nowhere to be found.
All of this is of course extremely irritating, so I thought I would create new neighbourhoods from scratch; you just draw a grid over the city, pick a ball around every grid point and then have the algorithm group the points together. Two remarks dazu:
- If you have a grid and draw balls around each point, you’re never going to have both the balls never intersecting and the full grid being covered. Setting the ball radius to be 75% of the grid step causes all of the grid to be covered while keeping intersections relatively low - but I also thought intersecting neighbourhoods were not that bad after all: if two neighbourhoods are close to each other I’d say they should have something in common for the very fact of being close to each other. This information is then partially passed on to the algorith by having points lying in the intersection;
- However, it turns out that’s not enough of a binding force to make connected clusters - and a quartiere has to be a connected cluster. If you just do a naïve run of the clustering without further information you do end up with one cluster having two connected components at the opposite parts of the city, which is of course not what you want. The solution is to feed also latitude and longitude to the algorithm, after the usual preprocessing.
So you can run the algorithm and decide what number of clusters you like and so on and so forth. There isn’t really a “right” answer, but it was nice to toggle the parameter a bit and look at the results. In the end I settled for 28 clusters, which give the following picture:
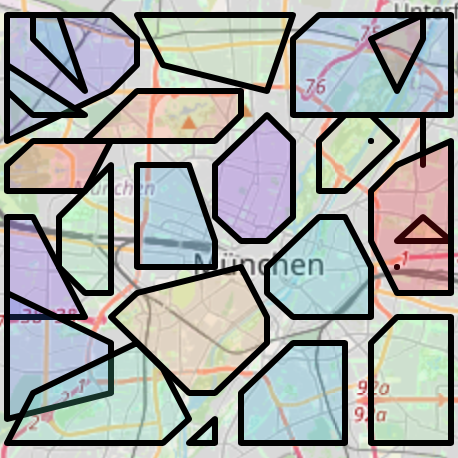
The Gewerbegebiete in the north and the zoo in the south got nicely clustered, also the various bathing spots along the Isar got their own neighbourhood. You can download the map as html file here and play with it.